Maps made easier: GeoJSON in the JavaScript Maps API
By Jen Kovnats,
Google Maps API Team
Cross-posted from the Google
Geo Developers blog
Maps give us an easy way to visualize all types of information, from patterns in
health
expenditure across the world, to oceans with the highest concentration of
coral
reefs at risk. The tools used to create these maps should be just as easy to use.
That’s why, starting today, the JavaScript Maps API will support GeoJSON, making it simpler
for developers to visualize richer data, with even cleaner code.
GeoJSON has emerged as a popular format for
sharing location-based information on the web, and the JavaScript Maps API is embracing this
open standard. This means, as a developer, you can now pull raw data from multiple data
sources, such as the
US Geological Survey or
Google Maps Engine, and
easily display it on your website.
How does it work? The new Data layer allows you to treat a dataset like… well, a set of data,
rather than individual and unrelated features. If you have a GeoJSON file, you can now load it
on the map simply by adding a single line of code to your JavaScript:
map.data.loadGeoJSON(‘earthquakes.json’);
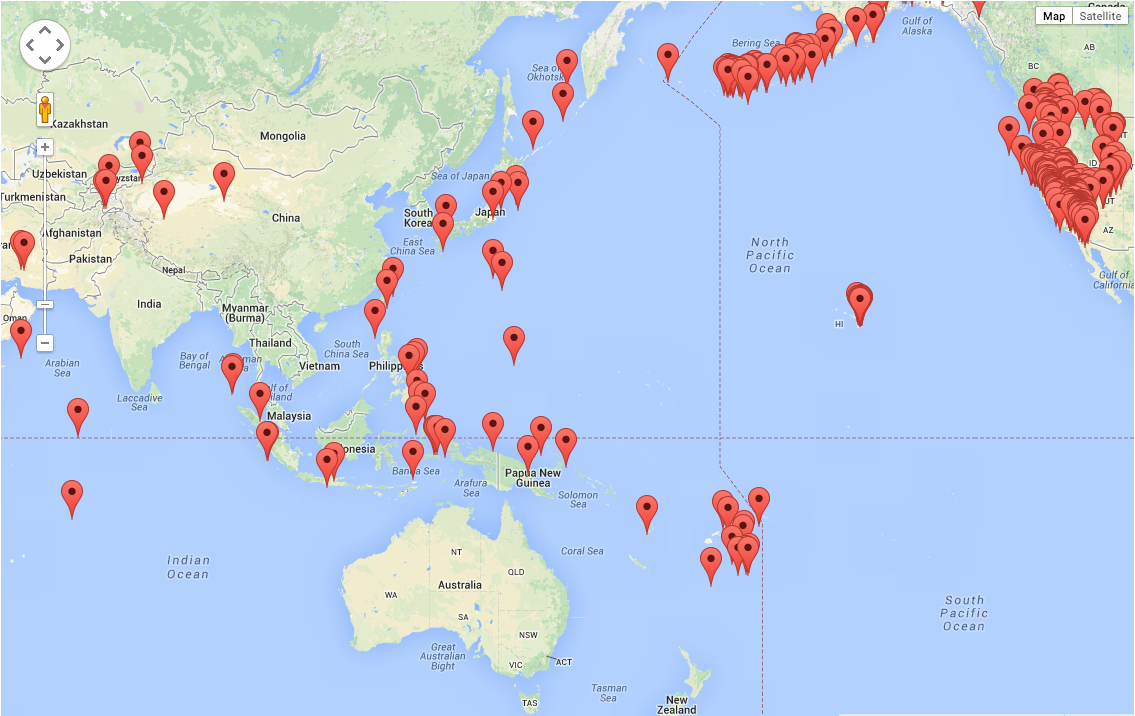
Earthquakes over the past week loaded
on the map
Tada! And what’s more, most places have attributes beyond just location: stores have opening
times, rivers have current speed, and each
Girl Guide troop has cookie
selling turf. The Data layer allows you to represent
all attributes in
GeoJSON right on the map and make decisions about what data to display more easily.
You can use this information to create a styling function that says, “show the earthquakes as
circles, scaled to their magnitude” and as the data or rules are updated, the styling will
automatically be applied to every feature. This beats having to manually update each feature
or rule as more information is added to the map.
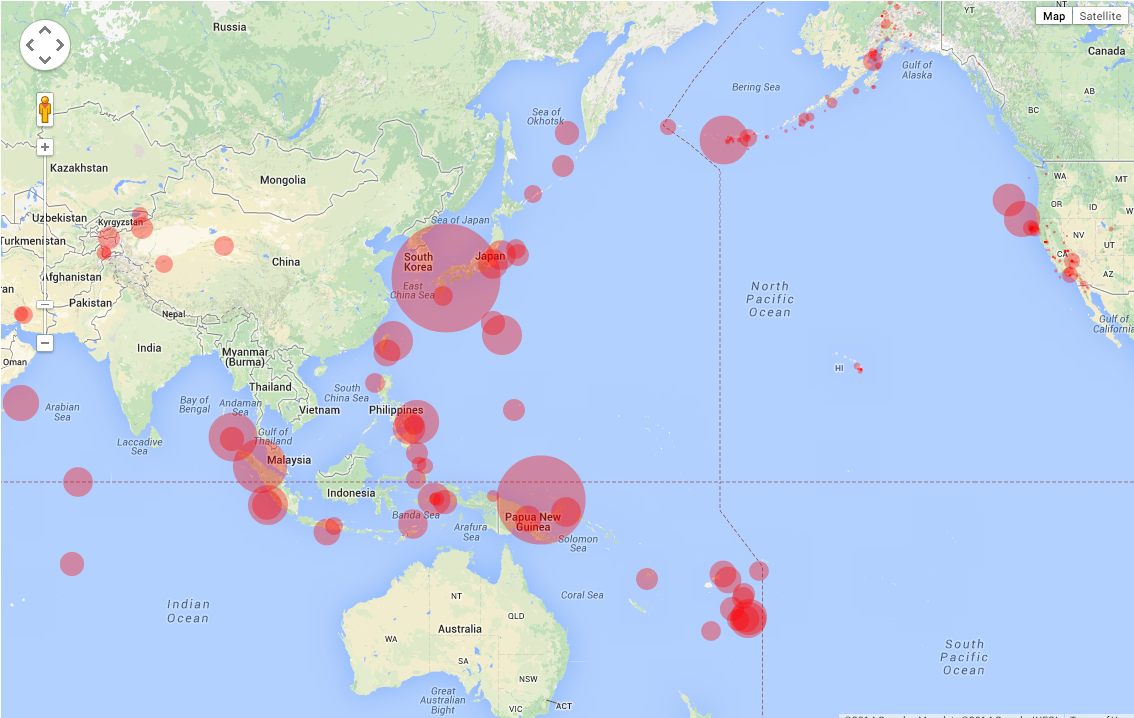
Earthquakes over the past week, with a styling function
applied
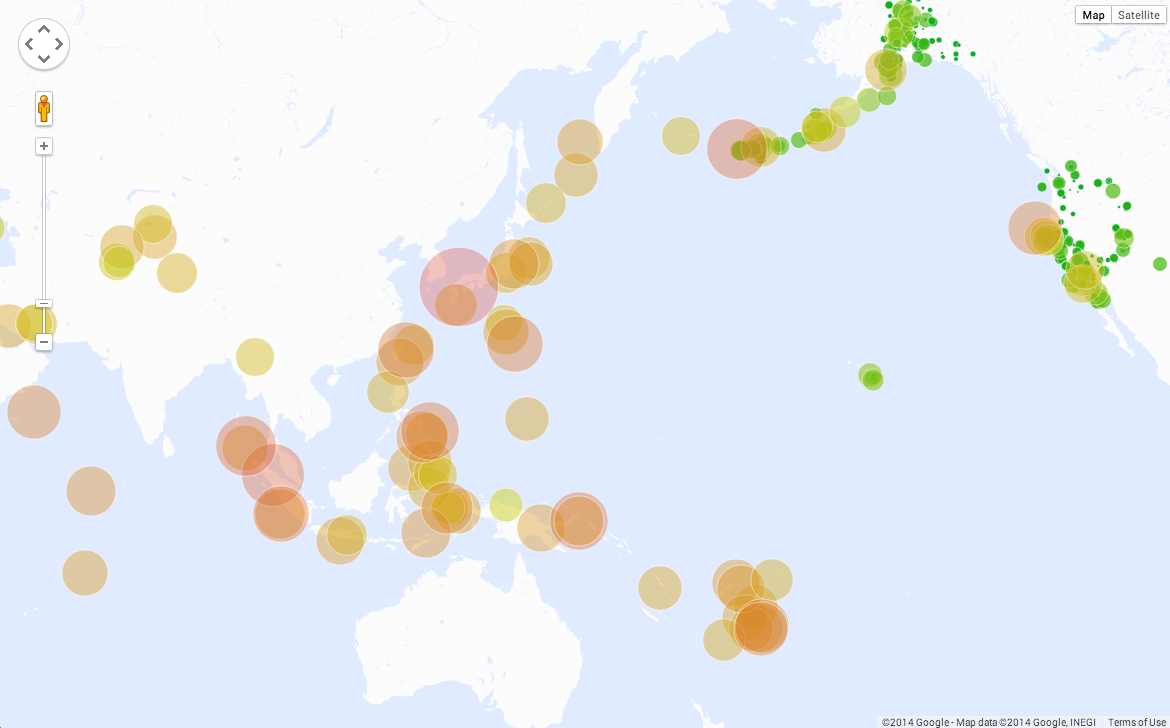
Earthquakes over the past week, with additional color and basemap styling
applied
Get started by checking out our
developer
docs, the
code
for these earthquake maps, this
cool demo
showing data from different sources, and this
Google Developers Live video.
This is a new feature, so if you run into problems or think of any additions you’d love to
see, get help on
StackOverflow
and check our
support
page for the right tags to use.
We’re looking forward to seeing what you build with this new tool and, as always, we’re eager
for your feedback. Please comment on this post or on our
Google+
Page.
Jen Kovnats is a Product Manager on the Maps API team bent on making mapping
easy.
Posted by Louis Gray,
Googler

