Measuring network performance with Resource Timing API
 By Ilya
Grigorik, Developer Advocate and Web Performance Engineer
By Ilya
Grigorik, Developer Advocate and Web Performance Engineer
Network performance is a critical factor in delivering a fast and responsive experience to the
user. In fact, our goal is to make all pages load in
under
one second, and to get there we need to carefully measure and optimize each and
every part of our application: how long the page took to load, how long each resource took to
load, where the time was spent, and so on.
The good news is that the W3C
Navigation Timing API gives us
the tools to measure all of the critical milestones for the main HTML document: DNS, TCP,
request and response, and even DOM-level timing metrics. However, what about all the other
resources on the page: CSS, JavaScript, images, as well as dozens of third party components?
Well, that’s where the new
Resource
Timing API can help!
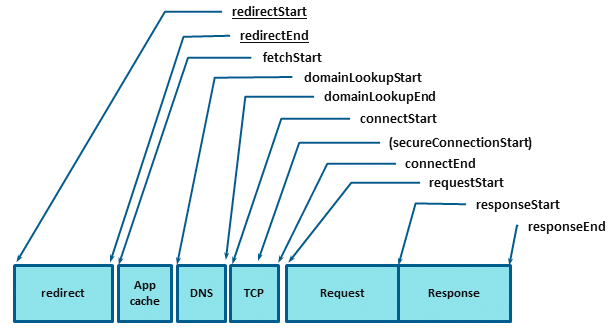
Resource Timing allows us to retrieve and analyze a detailed profile of all the critical
network timing information for each resource on the page - each label in the diagram above
corresponds to a high resolution timestamp provided by the Resource Timing API. Armed with
this information, we can then track the performance of each resource and determine what we
should optimize next. But enough hand-waving, let’s see it in action:
img = window.performance.getEntriesByName("http://mysite.com/mylogo.webp");

      var dns = parseInt(img.domainLookupEnd - img.domainLookupStart),
      tcp = parseInt(img.connectEnd - img.connectStart),
      ttfb = parseInt(img.responseStart - img.startTime),
      transfer = parseInt(img.responseEnd - img.responseStart),
      total = parseInt(img.responseEnd - img.startTime);

      logPerformanceData("mylogo", dns, tcp, ttfb,
      transfer, total);
Replace the URL in the example above with any asset hosted on your own site, and you can now
get detailed DNS, TCP, and other network timing data from browsers that support it - Chrome,
Opera, and Internet Explorer 10+. Now we’re getting somewhere!
Measuring network performance of third party assets
Many applications rely on a wide variety of external assets such as social widgets, JavaScript
libraries, CSS frameworks, web fonts, and so on. These assets are loaded from a third party
server and as a result, their performance is outside of our direct control. That said, that
doesn’t mean we can’t or shouldn’t measure their performance.
Resources fetched from a third party origin must provide an
additional opt-in
HTTP header to allow the site to gather detailed network timing data. If the header
is absent, then the only available data is the total duration of the request. On that note,
great news, we have been working with multiple teams, including at Facebook and Disqus, to do
exactly that! You can now use the Resource Timing API to track performance of:
Curious to know how long your favorite web font, or jQuery library hosted on the Google CDN is
taking to load, and where the time is spent? Easy, Resource Timing API to the rescue! For
bonus points, you can then also beacon this data to your analytics server (e.g. using GA’s
User
Timing API) to get detailed performance reports, set up an SLA, and more, for each
and every asset on your page.
Third party performance is a critical component of the final experience delivered to the user
and Resource Timing is a much needed and a very welcome addition to the web platform. What we
can measure, we can optimize!
(Note: due to long cache lifetime of some of the assets that are now Resource Timing enabled,
some users may not be able to get immediate access to timing data as they may be using a
cached copy. This will resolve itself as more users update their resources).
Ilya Grigorik is Developer Advocate at Google, where he spends his days and nights
on making the web fast and driving adoption of performance best practices.
Posted by Scott Knaster,
Editor